Observability Module
Introduction
Conscia’s DX Engine sits between your front‑end and every back‑end service, orchestrating real‑time API calls, caching, and business logic.
Because it is the connective tissue of your composable stack, first‑class observability is critical.
Observability Architecture
Application  ──▶  DX Engine (Query Node)
                 ├─ Component or Flow Execution
                    └─ Events Emitted at Request and Component Level
                         ├─ Analytics Aggregator
                         └─ Webhook Router
- Every Experience API call receives a Request ID.
- Component and Flow executions emit events and generate structured logs with details on response,
@debug,@extras, performance metrics). - Logs feed both real‑time dashboards and Webhook / external SIEM targets (Datadog, New Relic, Elastic, etc.).
Observability Dashboards
All dashboards share common controls:
- Select Dashboard — choose high‑level Request metrics or granular Component metrics.
- Time Range — dual date‑time pickers.
- Flow / Component Picker — multi‑select with type‑ahead.
- Submit — run the analytics query.
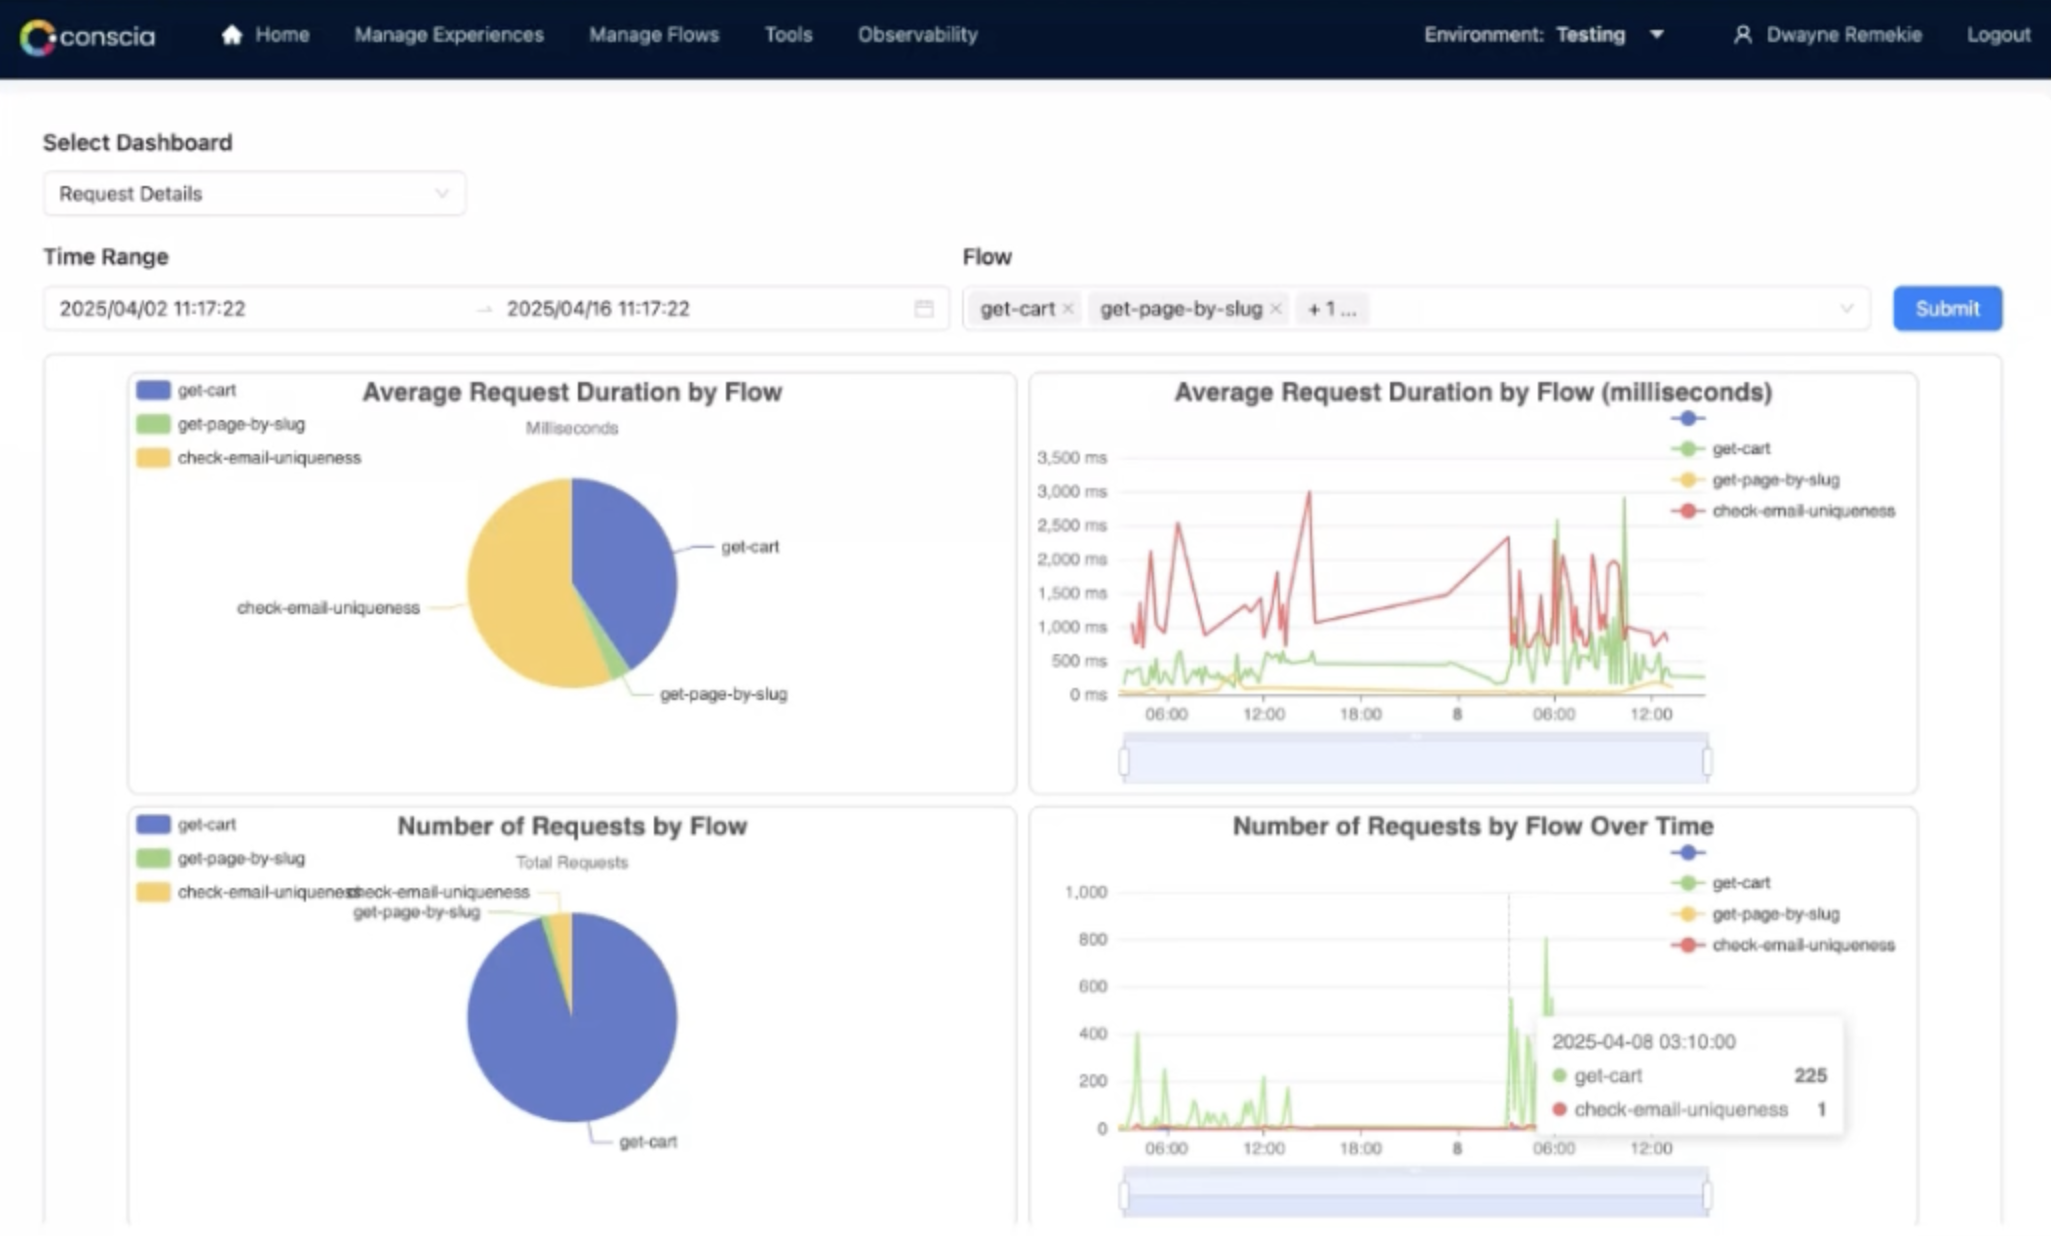
Flow-Level Request Details Dashboard
| Chart | Insight |
|---|---|
| Average Request Duration by Flow (pie) | Which flows contribute most to aggregate latency. |
| Average Request Duration by Flow (line) | Latency trend (ms) — zoom slider for spikes. |
| Number of Requests by Flow (pie) | Traffic distribution. |
| Requests Over Time (line) | RPS per flow; correlate traffic vs latency. |
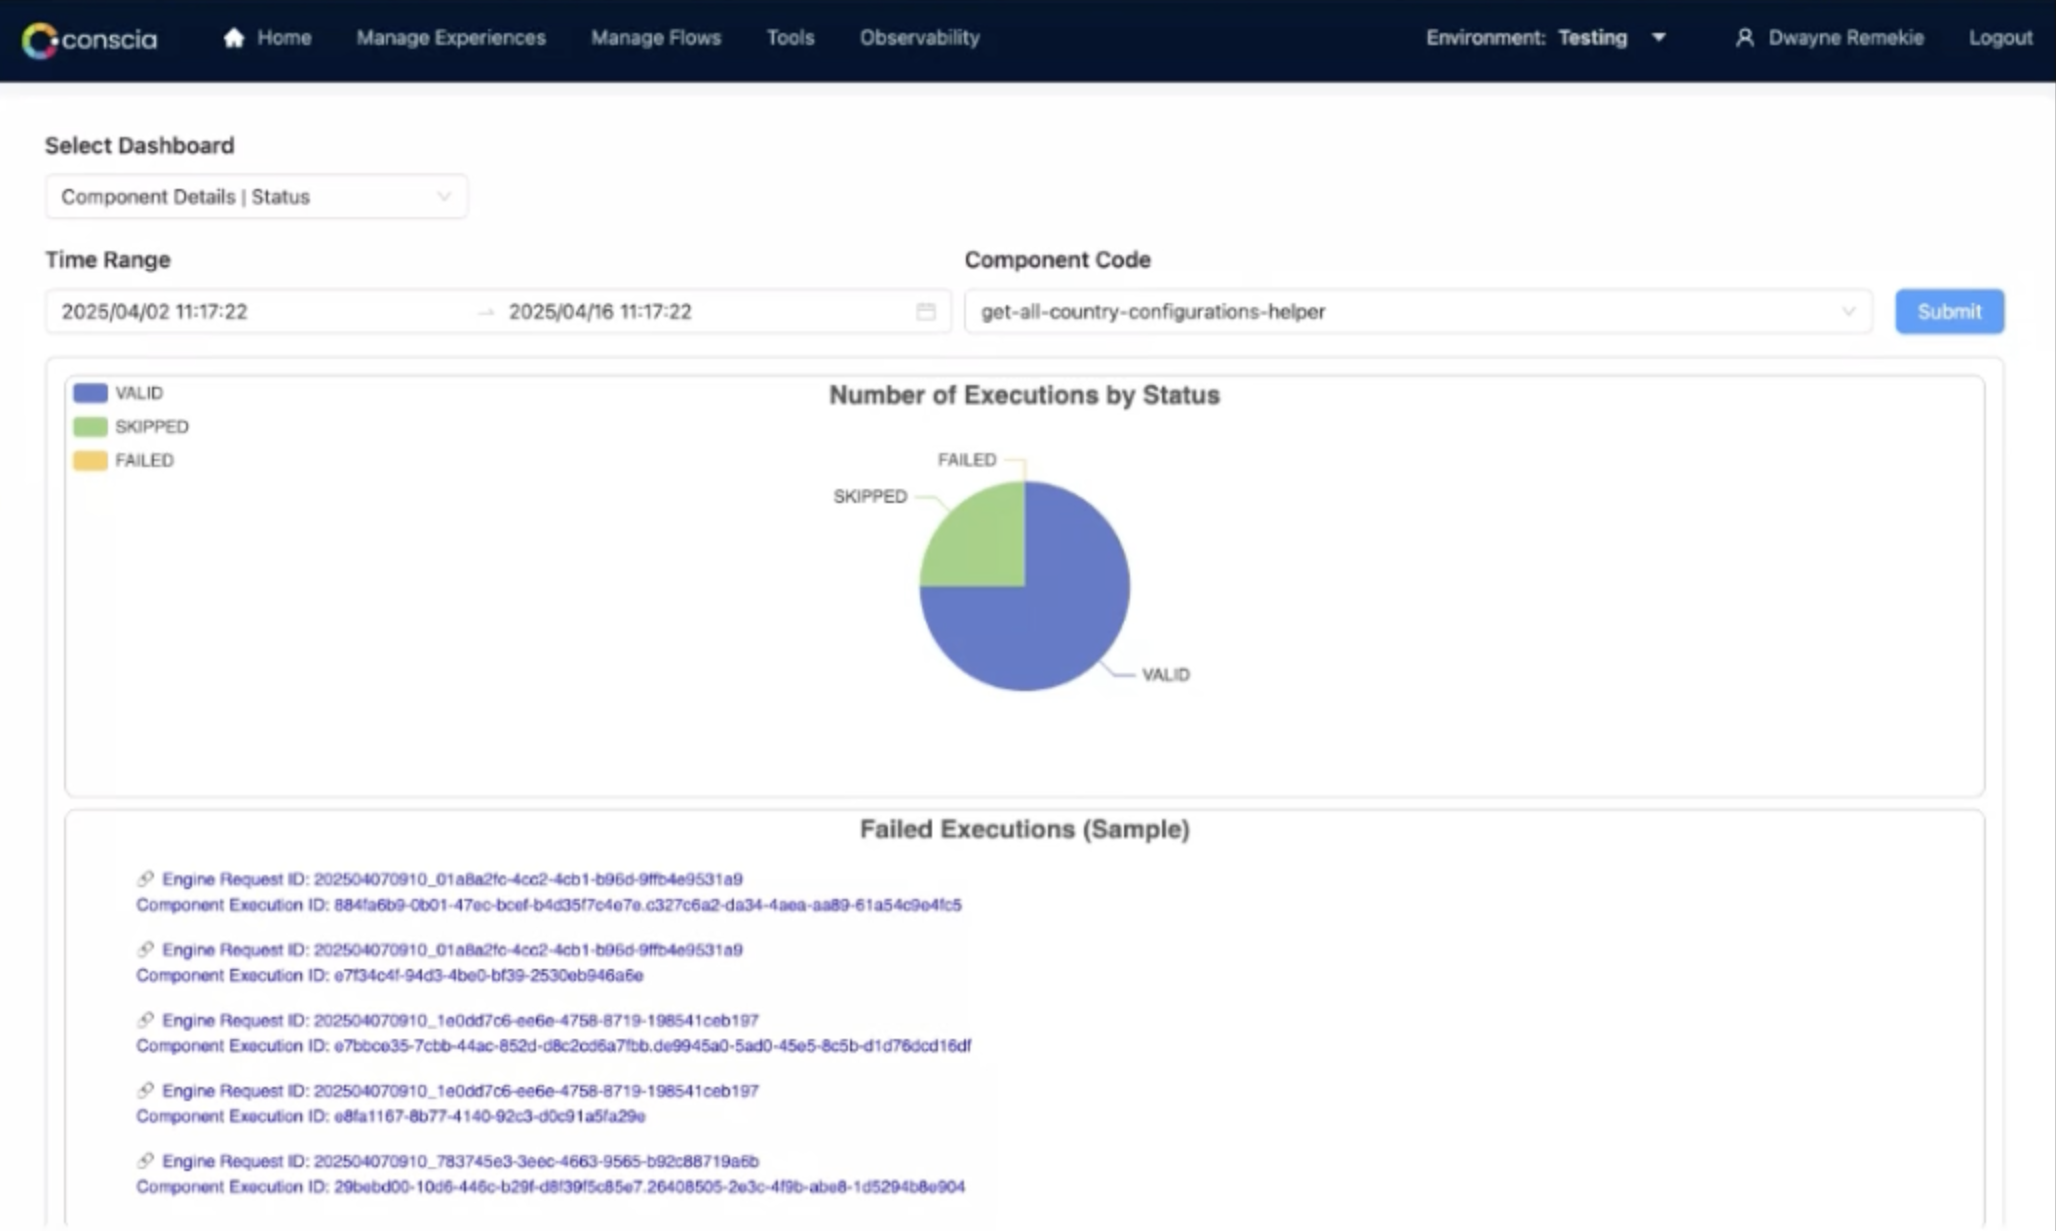
Component-Level Request Details | Status Dashboard
| Widget | Insight |
|---|---|
| Executions by Status (pie) | Ratio of VALID, SKIPPED, FAILED. |
| Failed Executions (Sample) | Hyper‑links to Request ID and Component Execution ID for debugger drill‑down. |
Component Details | Status
This dashboard provides the breakdown of status codes when a Component is selected. It also provides the list of the most recent failed executions.
Additional Tooling
| Tool / View | Purpose |
|---|---|
| Execution Analysis | Run live or mock queries; inspect dependency tree, component states, context enrichment, cache hits. |
| Query Request History | Audit trail of past Experience API calls - search for a specific Request ID. Note that this is currently available via the API |
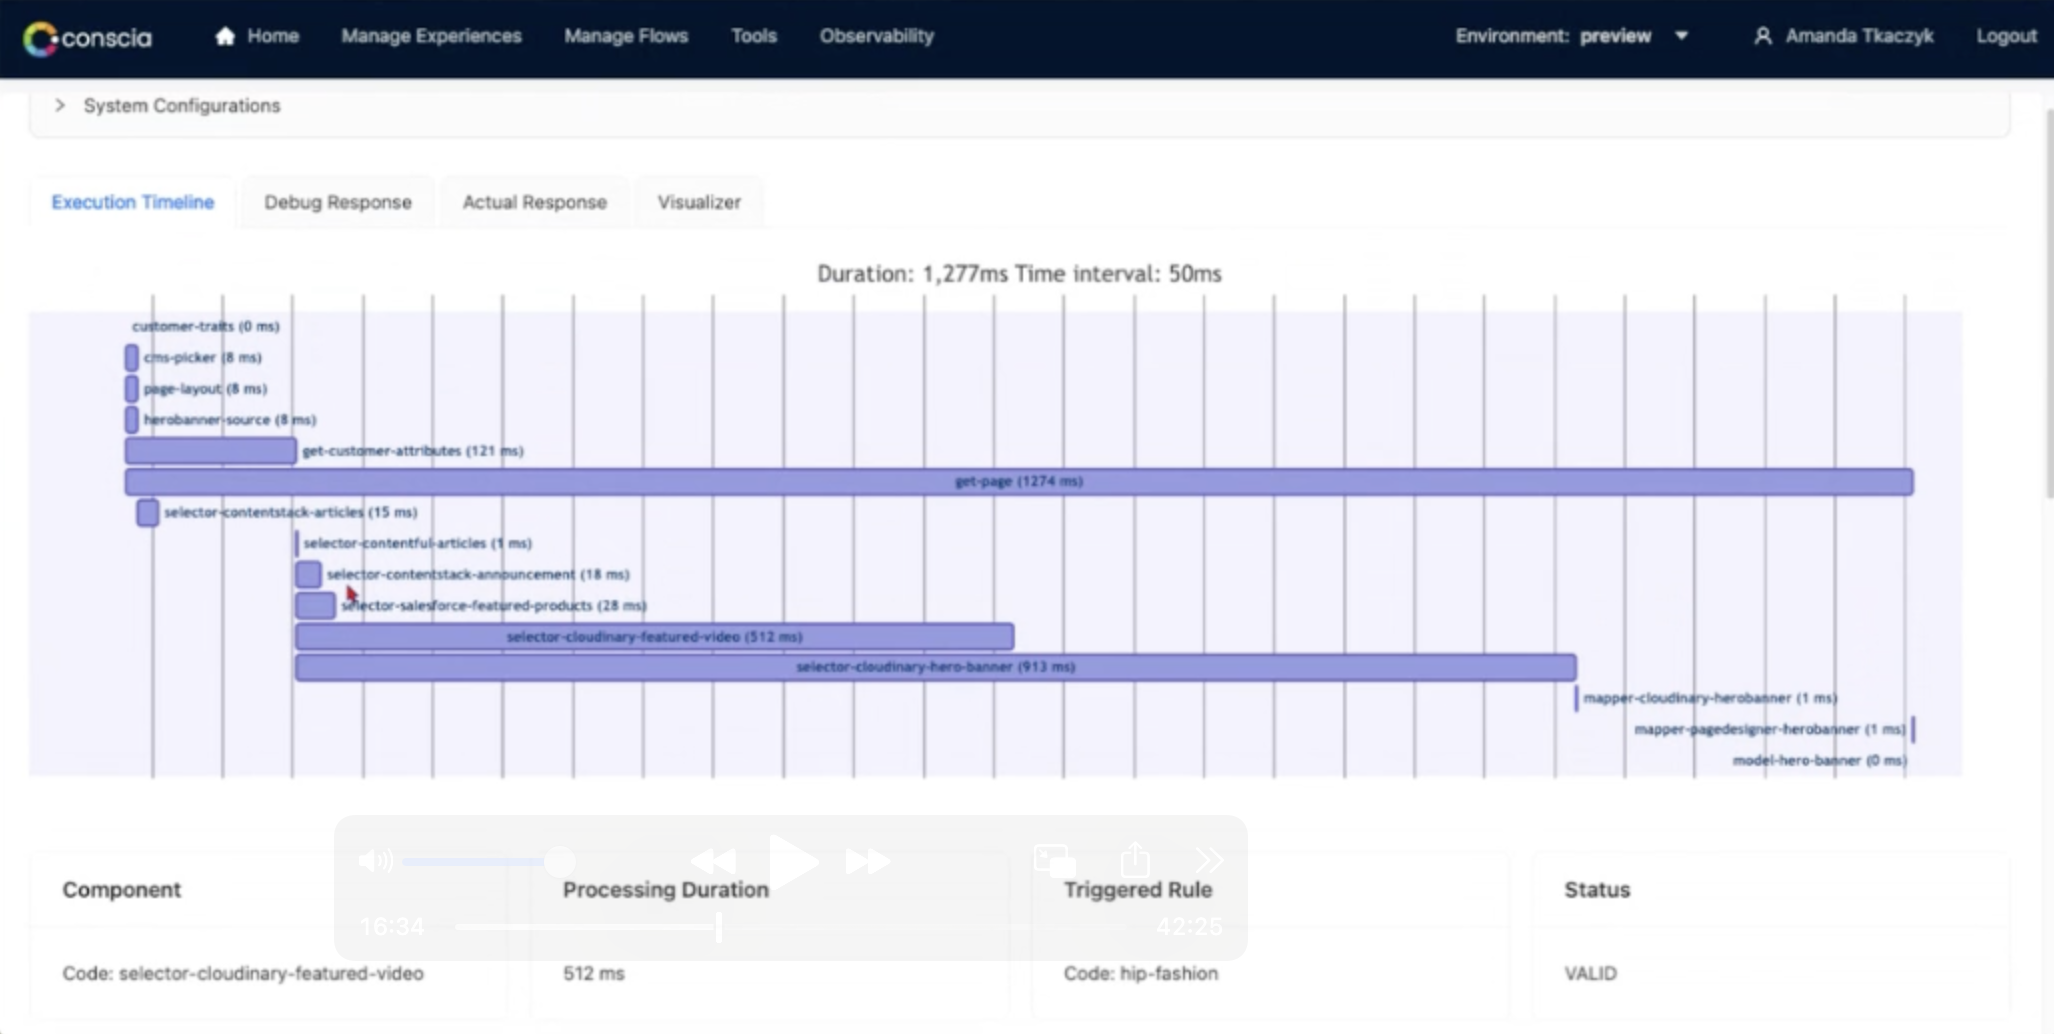
Execution Analysis
Here is the screenshot for a sample Execution Timeline that provides details of how the DX Engine processes each component or flow level request.
Executions API
There are endpoints for querying request-level and component-level executions.
Request-level executions API
This endpoint returns up to 100 Engine Requests that have been completed. The following querystring options are availeble:
minDuration- Only show requests with a duration greater than or equal to the specified value in millisecondsmaxDuration- Only show requests with a duration less than or equal to the specified value in millisecondstemplateCode- Only show requests for the specified template coderequestedComponentCodes- Only show requests that conatains all of the specified component code(s)engineRequestId- Only show the request that has the specified Engine Request IDtimeSort- Eitherascordesc. Default:descstartTime- Only show requests that have a start time greater than or equal to the specified value. Defaults to 12am today.endTime- Only show requests that have an end time less than or equal to the specified value. Defaults to now
Get up to 100 requests (from 12am today to now)
GET {{engineUrl}}/executions/request-completed
Content-Type: application/json
Authorization: Bearer {{dxEngineToken}}
X-Customer-Code: {{customerCode}}
X-Environment-Code: {{environmentCode}}
Get up to 100 requests with duration between 10 and 50ms (from 12am today to now)
GET {{engineUrl}}/executions/request-completed?minDuration=10&maxDuration=50
Content-Type: application/json
Authorization: Bearer {{dxEngineToken}}
X-Customer-Code: {{customerCode}}
X-Environment-Code: {{environmentCode}}
Get up to 100 requests with start time from 13:59:59
GET {{engineUrl}}/executions/request-completed?startTime=2025-07-28 13:59:59&timeSort=asc
Content-Type: application/json
Authorization: Bearer {{dxEngineToken}}
X-Customer-Code: {{customerCode}}
X-Environment-Code: {{environmentCode}}
Get a specific engine request response
This endpoint will fetch the full response of any given Engine Request ID
GET {{engineUrl}}/executions/request-completed/{{engineRequestId}}
Content-Type: application/json
Authorization: Bearer {{dxEngineToken}}
X-Customer-Code: {{customerCode}}
X-Environment-Code: {{environmentCode}}
Component-level executions API
This endpoint returns up to 100 Engine Requests that have been completed. The following querystring options are availeble:
minDuration- Only show requests with a duration greater than or equal to the specified value in millisecondsmaxDuration- Only show requests with a duration less than or equal to the specified value in millisecondstemplateCode- Only show requests for the specified template codecomponentCode- Only show requests for the specified component codecomponentTypeCode- Only show requests for the specified component type code (e.g.genericWebserviceCall,dataTransformationScript)status- Only show requests with the specified status (e.g.SUCCESS,FAILED,SKIPPED)engineRequestId- Only show the request that has the specified Engine Request IDtimeSort- Eitherascordesc. Default:descstartTime- Only show requests that have a start time greater than or equal to the specified value. Defaults to 12am today.endTime- Only show requests that have an end time less than or equal to the specified value. Defaults to now
Get up to 100 component-level executions (from 12am today to now)
GET {{engineUrl}}/executions/component-completed
Content-Type: application/json
Authorization: Bearer {{dxEngineToken}}
X-Customer-Code: {{customerCode}}
X-Environment-Code: {{environmentCode}}
Get up to 100 component-level executions with status SKIPPED (from 12am today to now)
GET {{engineUrl}}/executions/component-completed?status=SKIPPED
Content-Type: application/json
Authorization: Bearer {{dxEngineToken}}
X-Customer-Code: {{customerCode}}
X-Environment-Code: {{environmentCode}}
Get a specific engine request response
This endpoint will fetch all of the component responses for any given Engine Request ID. This is useful to debug specific component executions that you fetch with the above endpoints.
GET {{engineUrl}}/executions/component-completed/{{engineRequestId}}
Content-Type: application/json
Authorization: Bearer {{dxEngineToken}}
X-Customer-Code: {{customerCode}}
X-Environment-Code: {{environmentCode}}
Valid start and end time formats
- ISO 8601
- RFC 1123 - 5.2.14 RFC-822 Date and Time Specification
- A string containing 9..10 digit unix timestamp.
- A string with a date and a time component: YYYYMMDDhhmmss, DD/MM/YYYY hh:mm:ss, DD-MM-YY hh:mm, YYYY-MM-DD hh:mm:ss, etc.
- A string with a date, but no time component: YYYY, YYYYMM, YYYY*MM, DD/MM/YYYY, DD-MM-YY etc.
- A string with a day and time: DD, DD hh, DD hh:mm. In this case MM is substituted by 01.
- A string that includes the date and time along with time zone offset information: YYYY-MM-DD hh:mm:ss ±h:mm, etc. For example, 2020-12-12 17:36:00 -5:00