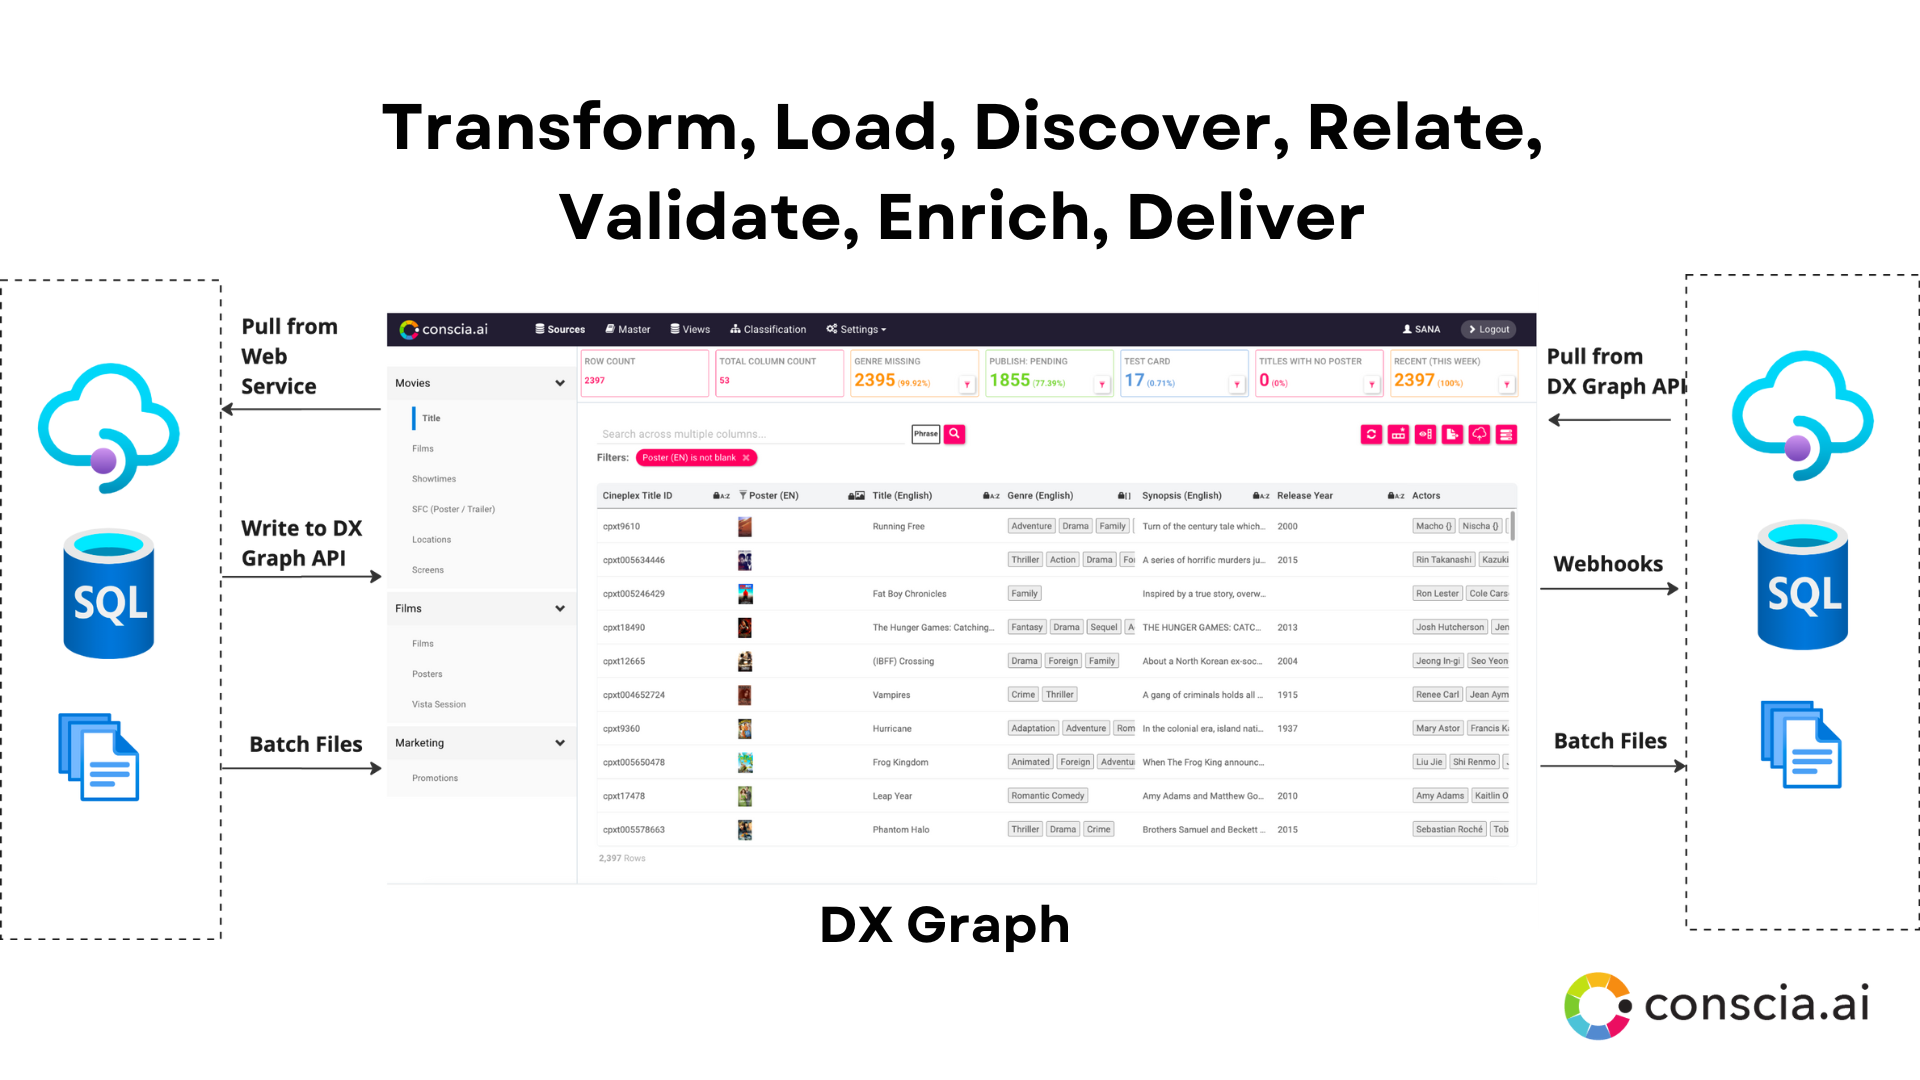
DX Graph - An API-First Data Layer
Conscia's DX Graph™ allows you to create a modern, API-first data layer on top of your existing data sources so that your content and data can be made available for modern experiences via APIs from a centralized repository. Conscia syncs data and content from external content and data repositories into a connected graph that provides a 360 view of all business entities involved in powering a customer experience.
Use Cases
The DX Graph can be used for the following use cases:
- Modernize Legacy Systems - Encapsulate legacy systems within an API-first data layer that is performant and scalable.
- Content or Knowledge Graph - A unified and connected view of content from multiple CMSs and content sources
- Master Data and Product Information Management - A connected view of data from multiple source systems that can be distributed to all downstream channels
- Enterprise Data Integration Hub - Transform and load data from any backend, including batch files in delimited, json or xml format, transform it to the schema you need, create a single view of all your data and publish it to any downstream channel.
Here is a visual depiction of what the DX Graph offers:

Working with the DX Graph
Loading Data into the DX Graph
- Loading data into a DX Graph Collection from a file. Learn More
- Loading data into the DX Graph Collection from a webservice endpoint. Learn More
- Creating a Job that validates, transforms, and imports data. Learn More
- Scheduling Jobs. Learn More
- Setting up validation when importing data. Learn More
Setting Up the DX Graph UI
- How to create a data model for each collection. Learn More
- How to create a custom view of data records within a Data Collection. Learn More
- How to create Field Groups in the Record Editor. Learn More
- Locking certain fields from source systems. This is done by making fields read-only via Data Model editor.
- Update Left Navigation to display data collections that have been loaded into the DX Graph.
Settings -> Left Navigation - Setting up rule cards to validate data collections. Learn More
- Creating Shadow Fields. Learn More
- Creating and applying taxonomies to label data collections. Learn More
- Creating relationships to connect data collections. Learn More
Getting Data Out of the DX Graph
- Configuring up DX Graph event triggers and webhooks. Learn More
- Accessing data in the DX Graph via APIs. Learn More
- Recipe: Updating Algolia on DX Graph Record Changes. Learn More
- Recipe: Loading Data from Contentful Webservice Endpoint. Learn More