
User Guide

There are times when data is sitting in legacy systems and is inaccessible via APIs. Even if the data is available through APIs, it requires a certain amount of conditioning before it can be consumed by your front-end. In this case, Conscia offers the ability to create a schema-agnostic graph that indexes data from various back-end sources and empowers non-technical users to validate, enrich, classify and normalize the data. This data in the DX Graph is available via real-time APIs to any client application. Conscia also offers the ability to push this data to any application via APIs, webhooks and file-based batch methods.

Every customer application can have a slightly different navigation structure depending on the capablities required and the workflows that need to be enabled. This includes labeling differences such Data vs. Content, Classification vs. Taxonomies.

The DX Graph's Data Studio has the following pages:

  • Sources / Content
    • These are data collections synced directly from source systems through the data load process.
  • Master
    • There are times when you need to unify data from multiple collections to create a master data record. For example, you may want to master a product record by pulling product information from a PIM, inventory and availability information from the ERP, product content from a CMS. You would create Master collections for such data and those collections would appear on this tab.
  • Taxonomies / Classification
    • On this page, you can manage taxonomy values for the various Taxonomy Data Collections. You can then apply the taxonomy to a target Data Collection on this page as well.
  • Files
    • Here you can upload files and manually run jobs that have been registered and/or scheduled within the DX Graph
  • Data Validation
    • Conscia offers configurable Inspector Cards which help users understand the quality of their data and identify areas where it can be improved. This page allows you to configure these inspector cards for each Data Collection.
  • Data Model
    • Here you can update the data model as well as the relationships between Data Collections.
  • Navigation Management
    • On this page, you can manage what data collections show up on your Mastes and Sources pages.
  • User Groups Membership
    • Here, you control the user groups that each user should belong to. Note that users are currently created via API only, however, you can add a user to a pre-existing User Group via self-service UI here.

Exploring Data From Source Systems

A list of data sources can be found within the 'Sources' or 'Content' tab in the top navigation.

alt_text

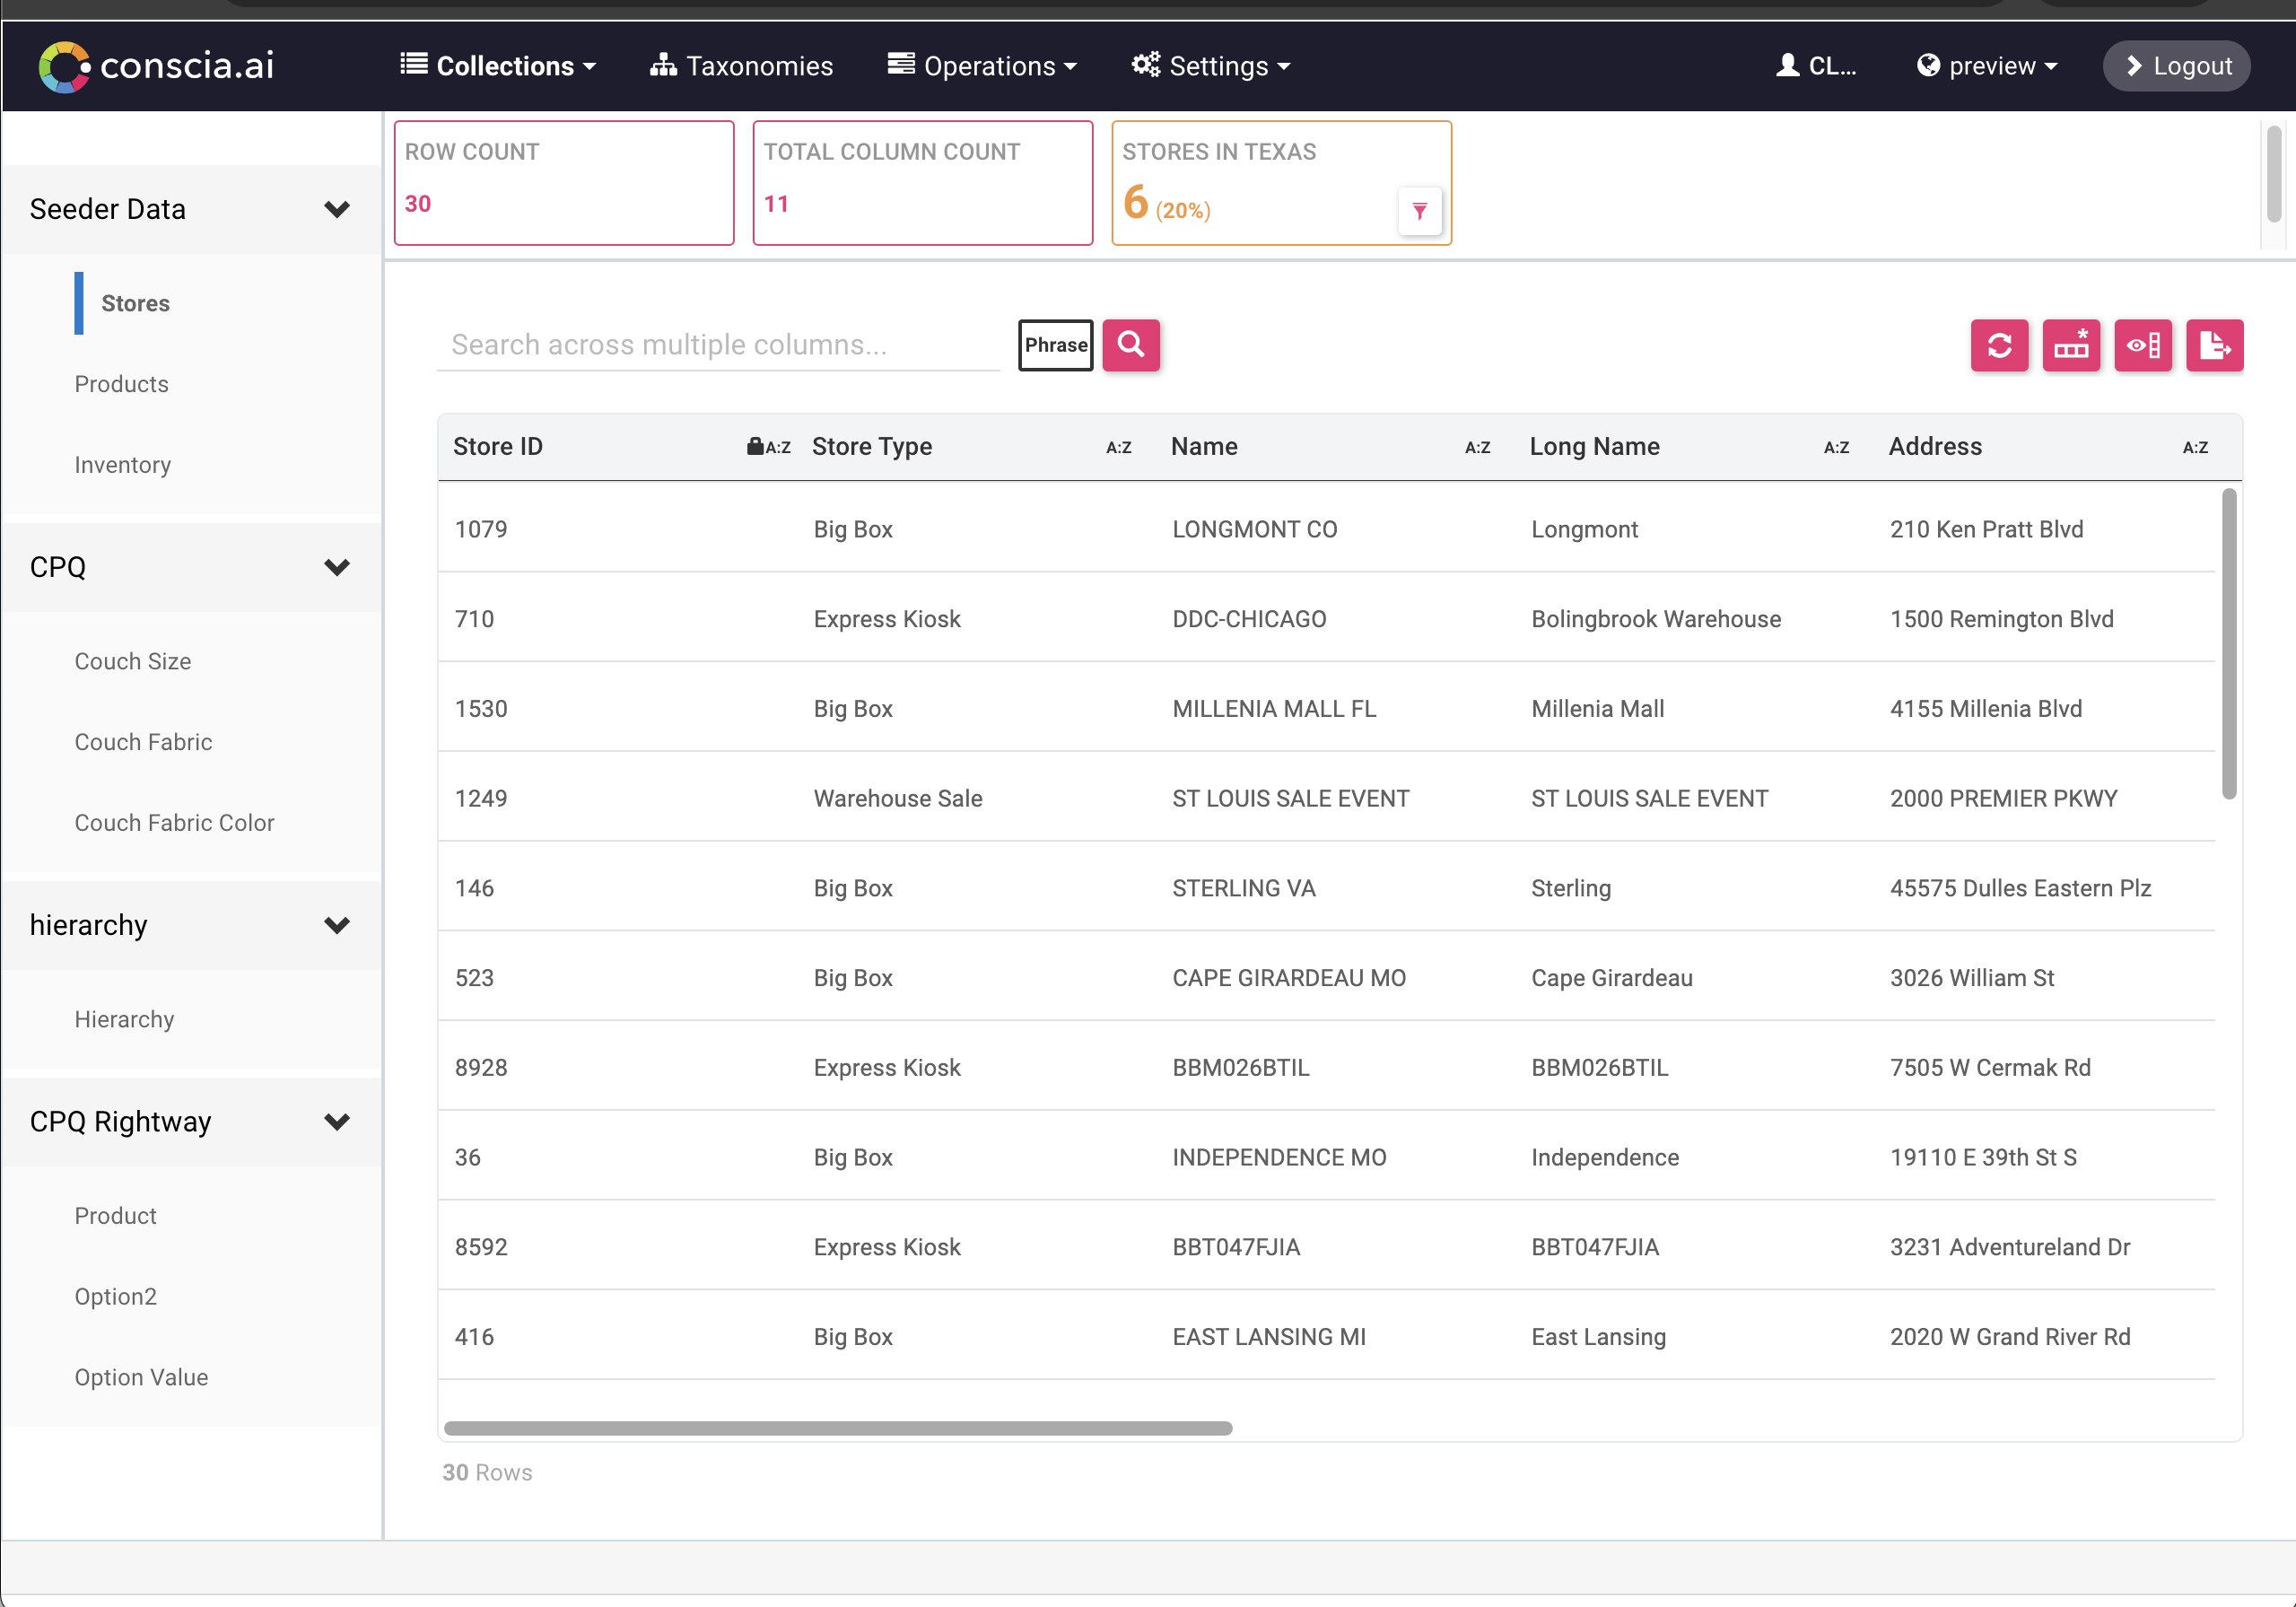
  1. Clicking on a Data Collection will display a grid with the data records that exist within the Data Collection as well as the inspector cards that have been configured.
  2. Selecting a record from the grid will bring up the record details in the record widget (bottom pane).

Data Collections

In DX Graph, data resides in Data Collections. A Collection contains records of a certain user-defined type, such as customers, products, stores, categories

Collections can be used to manage and/or analyze various types of data such as:

  • Master data (e.g. Customers, Stores, Products, Promotions)
  • Lookup data (e.g. Customer Types, Regions, Countries, Colours). When editing a record in another Collection via Data Studio, a drop-down list may be presented that is populated by the data records in a Lookup Collection.
  • Categorization data (e.g. Customer Audiences/Segments, Product Categories). Categorization data can be configured to hierarchical (i.e. records may have a parent record).

Collections may also contains data that falls under more than one of the above types of data.

Defining Relationships Between Data Collections

Data in Conscia is modeled as a graph, which means that data is interconnected and has relationships. Relationships not only allow for data to be associated with one or multiple data records, but also serves as a pathway for exploring data.

alt_text

Types of Relationships

There are three types of relationships within the Conscia

  1. 1-to-1 Lookup Relationship
  2. 1-to-Many Lookup Relationship
  3. Dynamic Relationships

Lookup Relationships (1:1 / 1:M)

  • This is the most basic type of relationship where a record within a collection is mapped to another record in a different collection. An example might be a record which contains a "status" code, but the status descriptor needs to be pulled from another collection.
  • Lookup relationships may be a one to one mapping or may be in the form of 1-to-Many where a single record may contain a relationship to many other records. An example might be a property record that contains references to multiple apartments within the property.

Dynamic Relationships

  • Using an expression to relate data records in one collection to data records in another collection, dynamic relationships are used to create links between otherwise unrelated records.

alt_text

In this example, the Apartments collection has several relationships, including:

PropertiesThis is a 1:1 relationship that allows each apartment record to contain the building (property) name
AmenitiesThis is a 1:M relationship allowing an apartment to contain many amenities
Price RangeThis is a 1:M relationship where the price of the apartment can belong to multiple price buckets (ranges)
PropertyThis is a dynamic relationship that directly connects the apartment to the property. When rendering the details of the apartment, full details from the property are also accessible.

Viewing Relationships

Relationships are defined as part of a collections configuration. Power users can view the relationship(s) configuration for a collection via the admin dashboards:

  1. Select SETTINGS > DATA MODEL from the main navigation
  2. From the list of data collections, select a collection by right clicking the record.
  3. From the inline menu, select EDIT > RELATIONSHIPS

alt_text

  1. Explore the different relationships by selecting a relationship type from the dropdown menu in the top right of the modal.

alt_text

  1. For any relationship, clicking on the arrow will expand the details of the relationship.

alt_text

Searching And Filtering Data

The Data Grid is the primary tool when exploring data. When searching and filtering for data within the data grid, the global search bar and column filters are both elements that can be leveraged to navigate data.

alt_text

The global search bar allows users to search across ALL fields for a specific term. Global search combs through the data within the entire collection and returns only records where a match is found. When searching using the global search bar, users should note that search matches against full terms (not partial matches). If partial matching is required, consider the “contains” function in the column filters.

alt_text

Column Filters

Column filters allow for multiple filter criteria to be associated (one per column) in order to return only records matching all criteria being returned. Column filters, for example, can be applied after a global filter has been applied. Available column filters include:

  • Contains
  • Equals
  • Not Equals
  • Starts With
  • Ends With
  • Ranges

To use a column filter:

  1. Hover of the target field header (the column type will change to an arrow)

alt_text

  1. Click the arrow, select the operator from the dropdown and and define your filter criteria and select ‘Apply Filter’

alt_text

  1. To layer on another search term, simply select another column and apply the desired search.

When column filters are applied, a filter balloon is created for each filter. To remove a filter, simply click on the “X”. To clear all the search filters, simply click the “X” in each search filter balloon.

alt_text

Validating Data Using Inspector Cards

One of the common challenges faced by organizations is the quality and heterogeneity of data residing in siloed systems. Before data is consumed by downstream applications, it is important to validate and subsequently optimize the quality of data. For each source collection, Conscia offers configurable Inspector Cards which help users understand the quality of their data and identify areas where it can be improved.

alt_text

Each Inspector Card is defined by a criteria which outlines the data that should be included (or excluded) when generating stats on the data records. Users have the ability to create, update and delete inspector cards and their criteria based on the use case in question.

Filtering data records using Inspector Cards

To activate an inspector card, simply navigate to the inspector card of interest, and click on the filter button in the bottom right hand corner of the card. This will activate the card and refresh all the statistics captured from all cards in the inspector widget.

alt_text

To deactivate a card, simply click on the “X”. This will release the card and again, the statistics for all the cards will be updated.

Overlapping Inspectors

Inspector cards can be combined with other inspector cards to provide analytics on the intersection of data associated to the criteria of each card selected. To combine inspectors, simply toggle to activate each inspector card of interest.

Example

Consider an inspector card that filters on "active only" products. This could be combined with a "missing information" inspector card to identify where product information is missing for live products.

Adding Inspector Cards

Inspector cards can be created by power users. To add new inspector cards:

  1. Select SETTINGS > DATA VALIDATION from the main navigation.
  2. In the dashboard, click the target data collection from the left hand side. Clicking on this collection will bring up all the inspectors associated to that collection

alt_text

  1. In the right panel, edit or create a new record.

    • When creating a new record, select the “Create Record” button in the ribbon

    • Provide a card ID (no spaces) and title leaving the “Filter” column blank (this will be automatically populated) in subsequent steps.

      alt_text

    • Click submit to return to the grid view.

    • Right click the newly created inspector card, and select “Edit Inspector Card Criteria

    • In the modal, drag operations from the left panel into the criteria builder canvas.

      • For each operation selected, click the node and enter the details in the right panel.
      • Save when all the criteria have been defined

    alt_text

  2. Activate the record

  3. Navigate back to the target collection and refresh the page to see the new inspector card(s).

Structuring Data

Viewing The Schema Of An Existing Data Collection

Each collection within Conscia has an associated “schema” that essentially defines its data model. The schema controls what information is presented to business users in the grid view as well as the record form. Power users can view the schema associated with each collection in the admin dashboards:

  1. From the top navigation, select SETTINGS > DATA MODEL. This will bring up a list of data collections.
  2. Select the target collection by right clicking the record
  3. In the inline menu, select EDIT > SCHEMA. This will bring up the collections schema which is illustrated as a series of field

alt_text

  1. Click on any of the fields to view the properties of the selected field. This is shown in the right most panel of the modal.

alt_text

Note that some fields may be nested. These will appear as a “+”. Clicking on the “+” to expand the field.

Shadow Fields

Shadow fields are a powerful tool in Conscia that allows digital teams to create views of data that address the needs of downstream channels. Shadow fields can be created and configured within the Schema Editor and use expressions to map one or more source fields to a target field. You can think of shadow fields as a form of a calculated field. We’ll look at two examples on how to use shadow fields.

The Use of Expressions

The Reference Application, Conscia Homes, uses SQL-like syntax to define Shadow Field expressions. In the latest version of the Conscia Graph, this has been updated to JSONata (https://jsonata.org/). JSONata supports:

  • A lightweight query and transformation language for JSON data
  • Inspired by the location path semantics of XPath 3.1
  • Sophisticated query expressions with minimal syntax
  • Built in operators and functions for manipulating and combining data
  • Creating user-defined functions
  • Format query results into any JSON output structure

Example 1: Renaming a field

Let’s say that you have synced some blog content from Acquia. The naming convention in Acquia does not map well to the data model expected by the front-end application. There is a field called ‘name’ in Acquia that is expected to be called ‘name_en’ by the front-end application.

In order to map 'name' in the source to'name_en' in the view, we’ll create a new shadow field (called name_en) that will get its value from the existing field.

  1. In the schema builder, drag a new text field onto the schema.
  2. Click on the new field to bring up the field properties
  3. Add or set the following properties:
    1. Under the “NAME” field, enter “name_en”
    2. Under the “DISPLAY NAME” field, enter “Name (English)”. This is the user-friendly name that will appear as the column header in the grid view and the record forms.
    3. Select the “SHADOW FIELD” checkbox.

alt_text

  1. In the newly exposed “Shadow field expression” field, enter {{base}}.name

alt_text

  1. Save the schema by hitting “SUBMIT”

{{base}} is a reference to the source record and provides a handle to the fields within the record. So, setting an expression of {{base}}.name will populate the name_en field with the value of name.

Example 2: Creating an Override Field

In this example, we’ll assume two fields exist: name and name_override. The goal of this example is to pass the correct value to a downstream system (depending on whether an override name is defined). This is useful when giving the product teams some control over what appears in the downstream application without changing the source data.

  1. Create a new shadow field called “name_final”
  2. In the shadow field expression, enter the following:
TO_STRING( {{base}}.name_override || {{base}}.name )

alt_text

  1. Save the schema by hitting “SUBMIT”

The above expression looks at both the name and name_override field. If the name override field has a value, the shadow field will get this value. If name_override is blank, it will default to getting the value from name (the “||” serves as an OR operator). The end result is name_final is populated with the override if one exists.

More Examples

The shadow fields can evaluate complex expressions and provide a lot of control over the data model that is published to downstream systems. Here are some other use cases that we won’t detail out in this document:

  • If a field value needs to be sourced from more than one source collection, you can specify a cascading priority such that the most relevant value is used.
  • Stitch multiple fields within one or more collections to create a target field
  • Take top level fields and turn them into a nested object or an array
  • Take a nested source field and pull out specific values into a top level field
  • Use conditional logic to transform field values from source to target
  • Anything else you can imagine!

Making Fields Read Only

In certain scenarios, you may find it necessary to restrict specific fields within a collection's data model. This can be achieved through setting fields as read-only, ensuring data integrity and preventing unintended alterations.

  1. In the top navigation, select SETTINGS > DATA MODEL
  2. Navigate to the collection of interest and right click it to bring up the secondary menu
  3. Select EDIT > EDIT SCHEMA
  4. In the schema editor window, select the field you wish you edit. Doing so will bring up the fields properties in the right hand panel.
  5. Scroll down to the "Settings" section, and click "Read-Only".
  6. Repeat the same process for other fields as needed
  7. Click submit to save the schema changes.

Sample Collection

When viewing the collection in a data grid, any field designated as read-only will appear with a lock icon in the field header. By utilizing this feature, you can confidently manage sensitive data and ensure that essential fields remain secure and unaltered.


Classifying Data with Taxonomies

Create New Taxonomy Values Within An Existing Taxonomy Collection

Conscia includes a powerful taxonomy management feature that enables customers to automate classification reducing the manual workflows and the burden on data and information management teams.

Taxonomy collections are a unique type of collection. They contain special records, each with an underlying, user-defined criteria. When attributes of source data records satisfy the criteria (or conditions) associated to the taxonomy value, a taxonomy tag is applied to the record on the target data collection. Records can be tagged with multiple auto-classified values or untagged with a taxonomy value when the condition is no longer satisfied.

To create a new taxonomy value

  1. From the main navigation, navigate to CLASSIFICATION or TAXONOMIES
  2. In the dashboard, select a taxonomy collection from the left nav.
  3. Create a new taxonomy record by selecting the “Create Record” icon from the ribbon

alt_text

  1. Enter a rule name, description mark the rule as active, and submit the record. This will create the taxonomy record to which we can now add criteria to.
    1. The rule name is used as the target for the target collection

alt_text

  1. Once the criteria is defined, click SUBMIT to save the record.

Set Up Logical Criteria To Map Taxonomy Values To Source Data

  1. Right click on the newly created taxonomy record and select EDIT RULE CRITERIA.
  2. In the new modal, drag and drop criteria from the left onto the canvas (middle) in order to build the taxonomy rule.

alt_text

  1. For each field added to the canvas, select the field and then define which field in the target collection it maps to.

alt_text

Apply Taxonomy To Source Data Collection

When the taxonomy is applied, any records matching the taxonomy record criteria are automatically tagged with the taxonomy (rule) name. To apply the taxonomy:

  1. Select the APPLY TAXONOMY button from the ribbon to apply the taxonomy to the source (this step is not required in a production environment)

alt_text

  1. In the modal, select CONFIRM.
  2. The Apply Taxonomy task will run in the background and generate a completion notice.
  3. Once complete, navigate to the source collection to view the applied taxonomy values.

alt_text

Enrich And Normalize Data

Clean Up Data Using Find/replace, And Other Bulk Operations

Oftentimes it is necessary to migrate data from one location to another. As part of this exercise, cleaning up the data is undertaken in order to create a “clean slate”. Conscia supports this by providing a toolbox of bulk operations that can be run on the data to perform various tasks such as find / replace, mass apply and type conversion.

alt_text .

To access the data operations:

  1. Navigate to the source collection and field of interest
  2. While hovering over the field header, click on the arrow to expose the inline menu
  3. From the menu, select TRANSFORM and the target operation.

Note that each field will display a different set of transformations (only those transformations applicable to the current data type are shown).

Data Normalization with Bulk-Apply Data Transformation Features

When you are pulling data from multiple data sources and/or is being managed by siloed departments and teams, it is common to have inconsistencies.

The following transformations are available to standardize and normalize your data through Control Center and can also be operationalized as data preparation recipes that can be applied on a schedule.

Enrichment FeatureDescription
Change CaseChanges the sentence case of values in the selected column and data set.
Concatenate FieldsCombines two columns into a new column with values separated by a user-specified delimiter.
Convert Array to StringConverts the values in an array to a delimited string.
Convert Date Field FormatConverts date values in a selected field to an alternative date format.
Convert Field to NumberChanges the type of a field by converting it from a text to number
Convert Field to TextConverts the type of a field to text
Remove Non-printable CharactersRemoves any non-printable characters found within the values in a field
Trim WhitespaceRemoves whitespaces in values of the selection column
Find and Replace (Single)Find a specified pattern in the data set and replaces it with the user defined value or pattern
Find and Replace (Multiple)Allows a user to reference a collection containing a series of find and replace values. When a value is found in the target column, it is replaced with the corresponding value from the lookup table.
Mass Apply (Single)Overwrites a field value with a user defined target value
Mass Apply (Multiple)Overwrites values in the target column. The user can define either to overwrite the target column with the mass applied values, or append the values to the end.
Mass RemoveRemoves a value from a selected field
Group Children RecordsAggregates child records under a parent record
Extract PatternTakes in a regular expression (regex) pattern and outputs a new column containing text which matches the user defined pattern. Each match is separated by a pipe (|) in the new column.
Extract Unique ValuesExtracts all unique values stored within a field. Output is stored as a separate collection.
Spell CheckChecks the spellings of words in a string column and suggest correct spellings.
Split Field (Single)Splits data into separate columns given a character. Contents of this column will be split on the given character and stored in a new single array column
Split Field (Multiple)Splits a value within the target field into multiple fields. The number of generated fields is based on the number of delimiters found.

Distribute Data in the DX Graph to Downstream Applications

There are three ways to access data in the DX Graph:

  1. Real-time APIs
  2. Export a data collection from Data Studio using the Export function at a Data Collection level
  3. Export a data collection using an API endpoint (Documentation Coming Soon)
  4. Set up a Webhook to be notified of changes within a data collection (Documentation Coming Soon)